
2.4.1. Data Analysts - Aspects Platform#
The Global Teacher Campus Platform runs a data analytics platform, referred to as the Aspects platform, which allows data analysts to explore multiple dimensions of the information gathered through the operation of the online course.
This section of the documentation will describe the functionality of the Aspects platform in detail.
Aspects is an analytics system for Open edX, bringing actionable data about course and learner performance to instructors and site operators. It is primarily a Tutor plugin that combines data from the Open edX learning management system and Studio using open-source tools to aggregate and transform learning traces into data visualizations.
Aspects capture learning events and transform them into data visualizations. When a learner enrolls in a course, that event is caught in a database and displayed to the course instructor as a graph of learner enrollments over time. When an instructor adds a new problem to their course and publishes it, the course data is refreshed in the database to show how learners answer the question.
Aspects is being built to help Open edX users answer questions like: - How many learners were active in a specified period? - How many learners are participating in forum discussions? - How often was this problem answered correctly vs. incorrectly? - How much of each video did the users watch, and which sections were re-watched most?
By default, Aspects focuses on learner privacy and does not include the ability to identify learners in the reports. This functionality can be added via plugins if desirable but can have negative performance and user interface issues for extensive courses.
2.4.1.1. How to Get Data Analyst Status#
A site operator or administrator with the necessary permissions should assign the permissions to you. In addition to seeing the Instructor Reports, you may get access to the Operator Reports and the ability to use the SQL Lab to run queries directly against the different ClickHouse data sources.
2.4.1.2. How to Access the Data Analytics Platform#
The aspects analytics platform is available at the following URL: <https://<aspects_URL>/>
When users access this URL, it will prompt them to initiate a session in the Open edX platform using their standard username and password, which they use to access the Open edX LMS or Studio.
2.4.1.3. Accessing the Data Analytics Dashboards#
To access an Analytics Dashboard, click the Dashboard tab and select the particular dashboard that you want to visit.
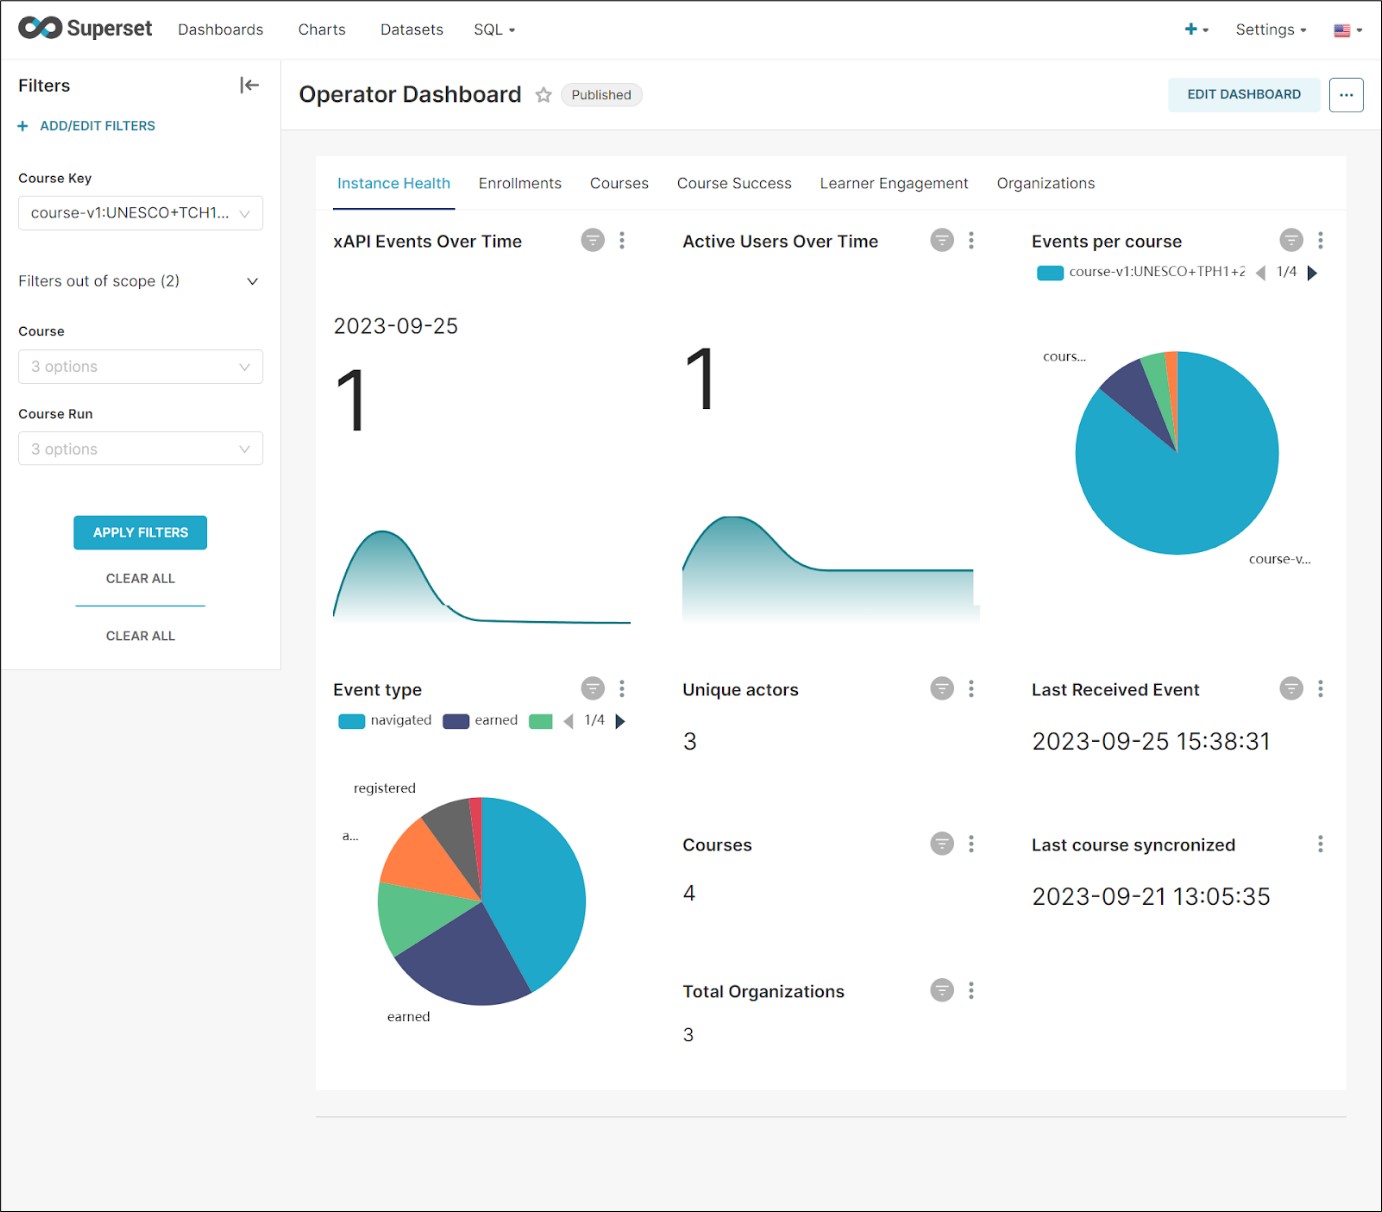
2.4.1.4. Applying Filters to the Information#
For any of the dashboards, you can apply specific filters to the information to restrict the results displayed to a particular set of courses, organizations, or periods.
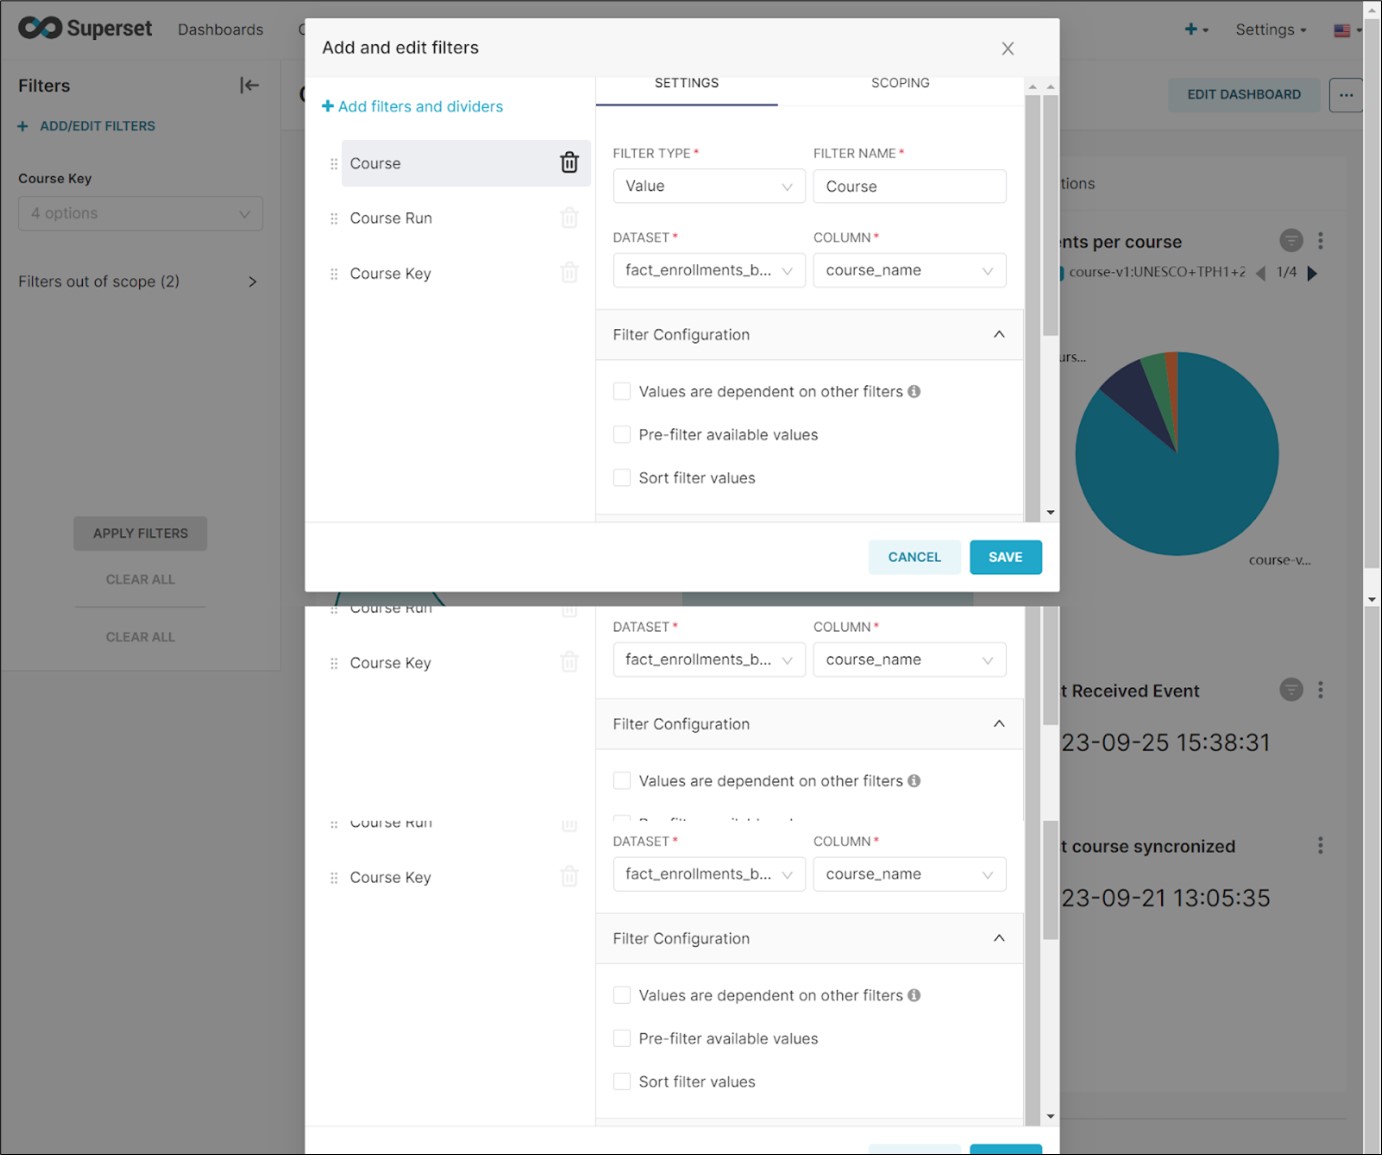
In the following image, you can see the Course Filter Settings Options.
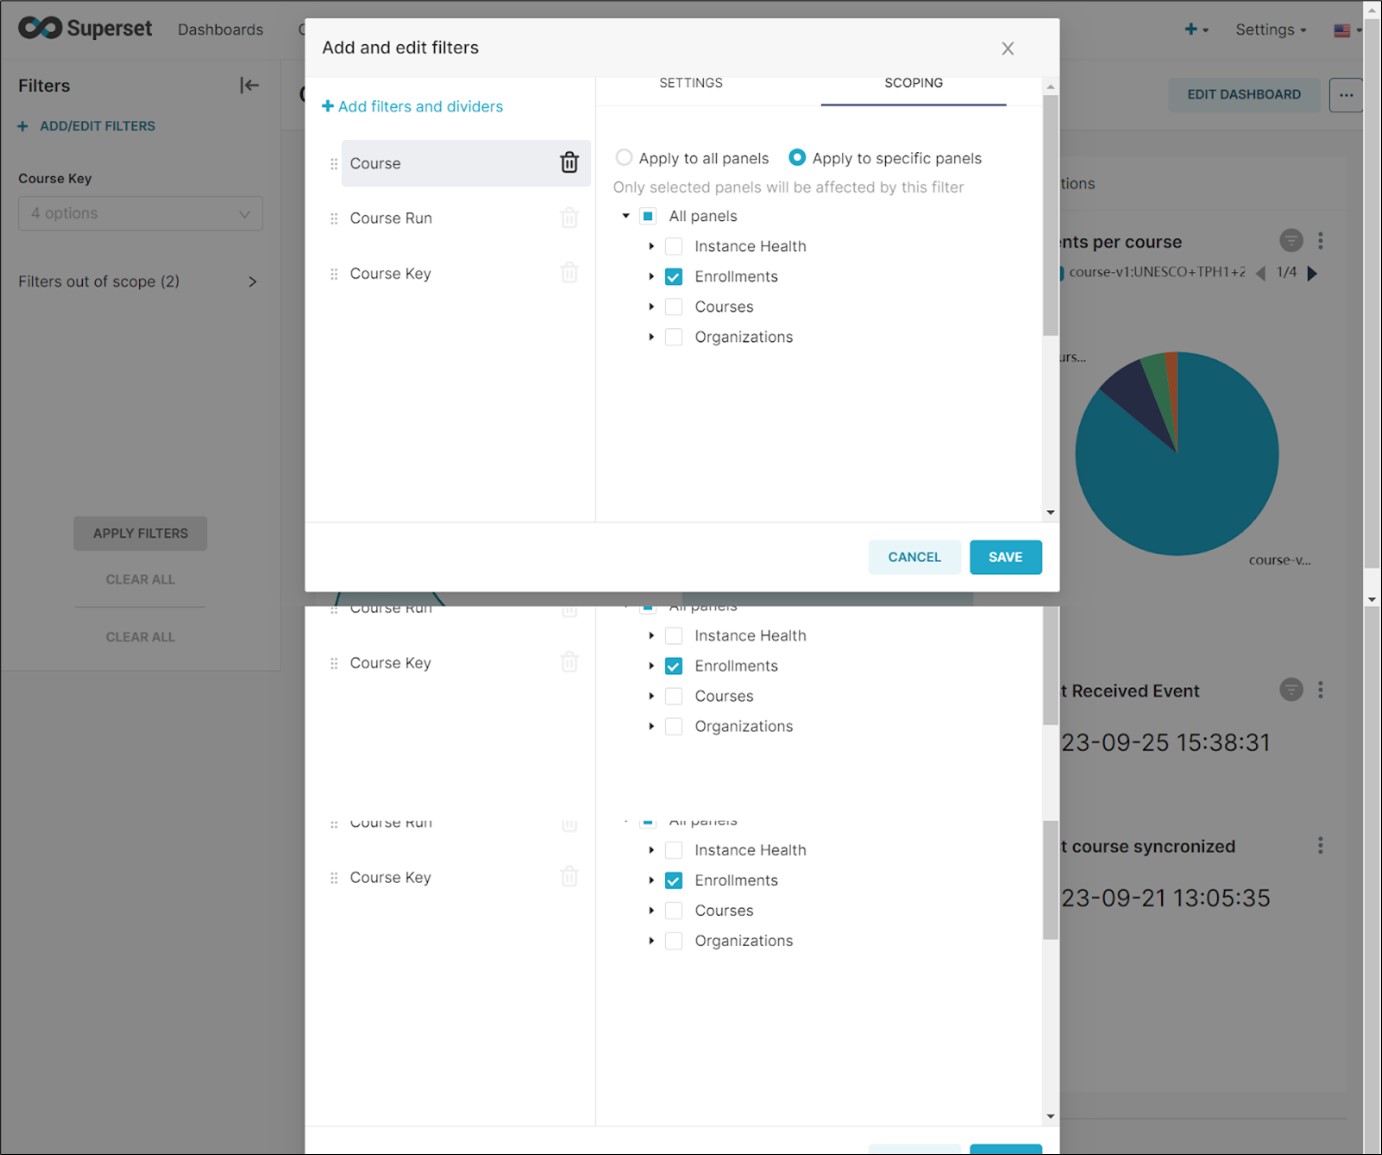
You will see the Course Filter Scoping Options in the image below.
2.4.1.5. Managing Charts#
You can access predefined charts with specific information by going to the Charts tab. Then, you can select a particular chart by clicking on its name.
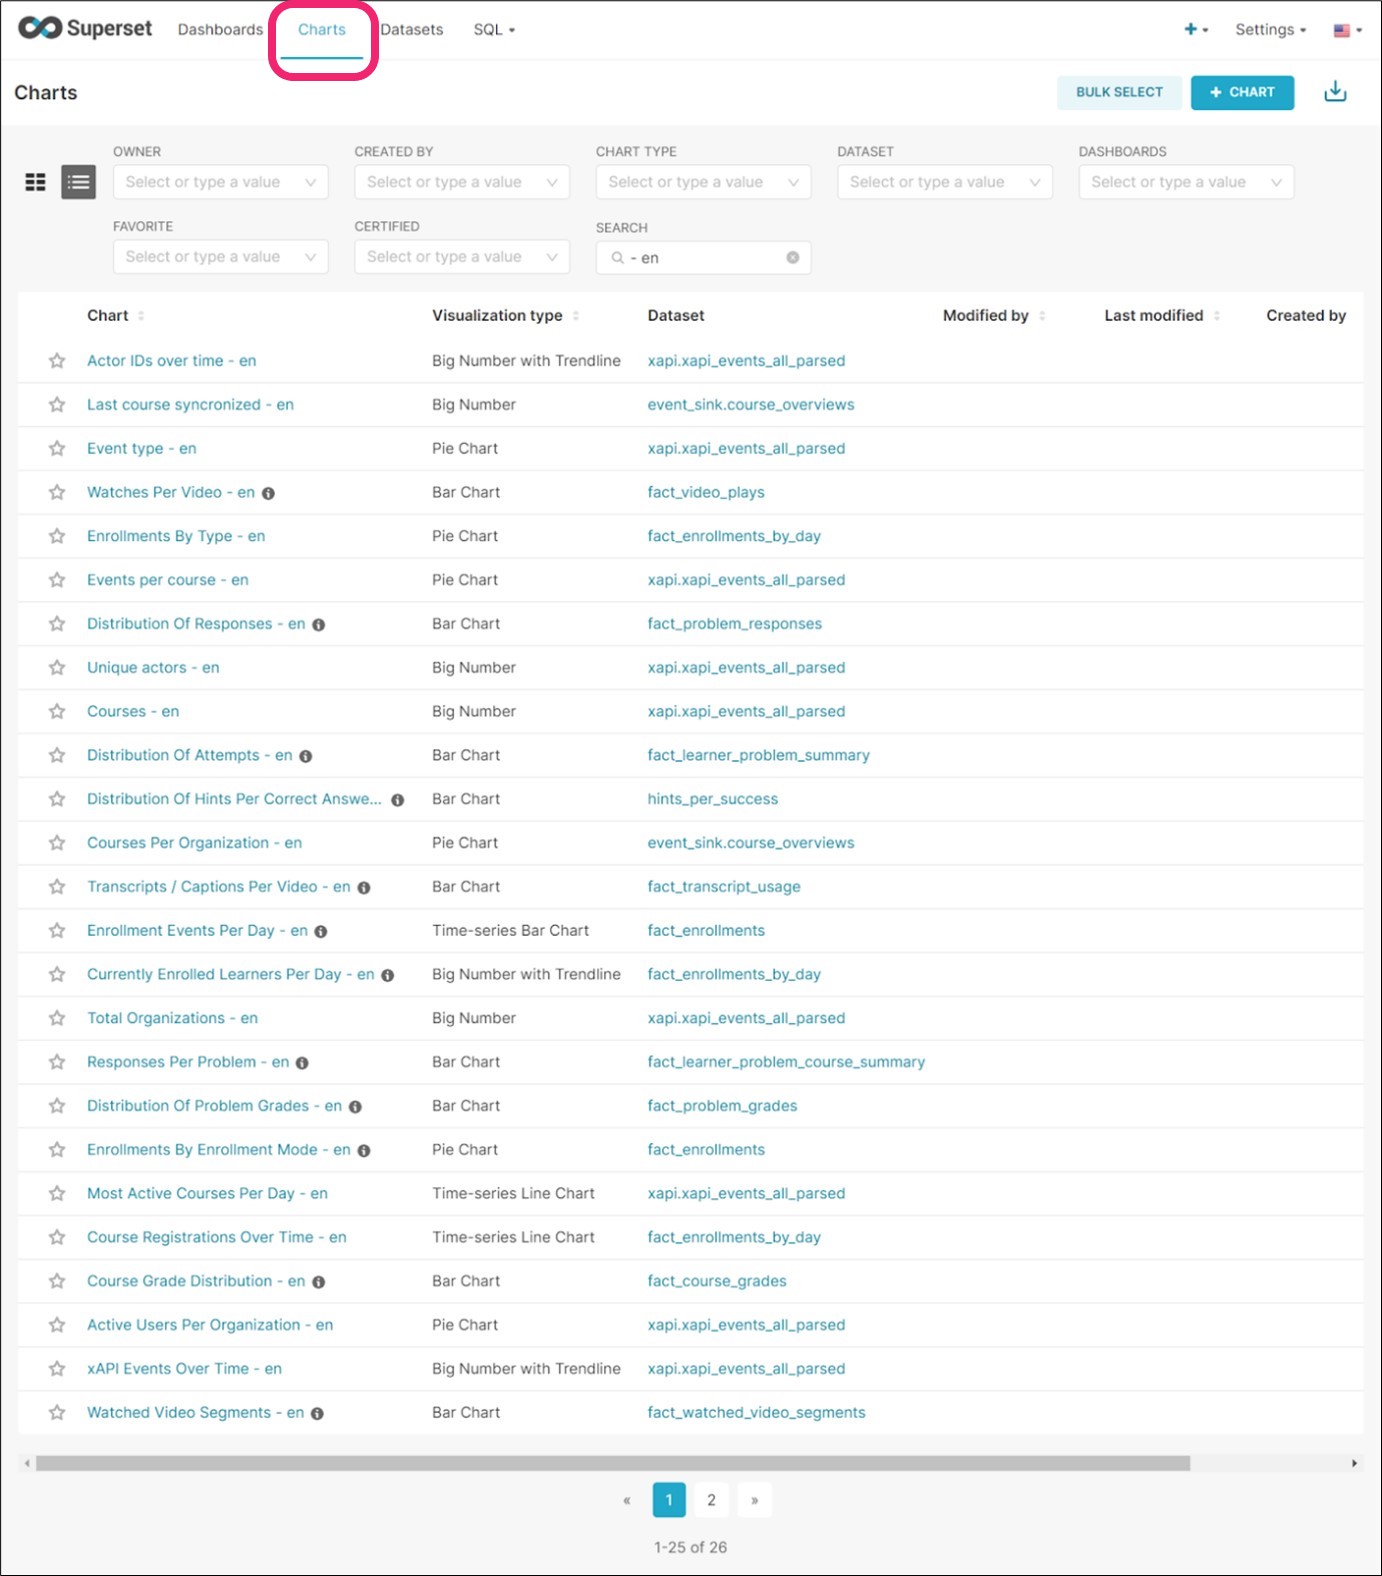
Each chart will display its configuration and customization options. You will be able to export the resulting information.
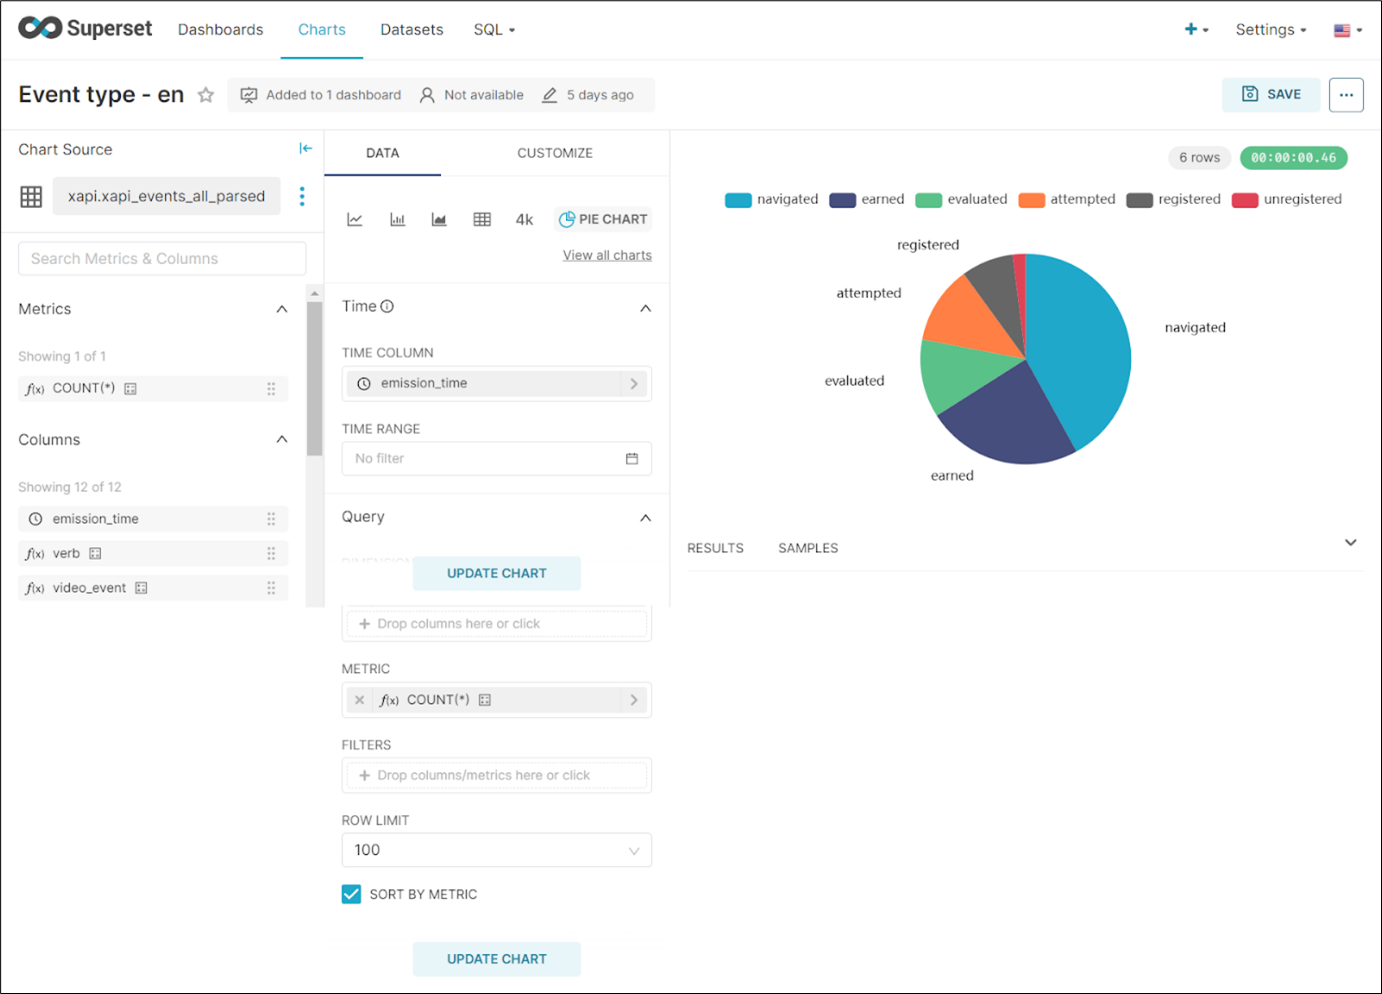
You can also create other charts using the visual interface and referencing the different data objects and properties available.
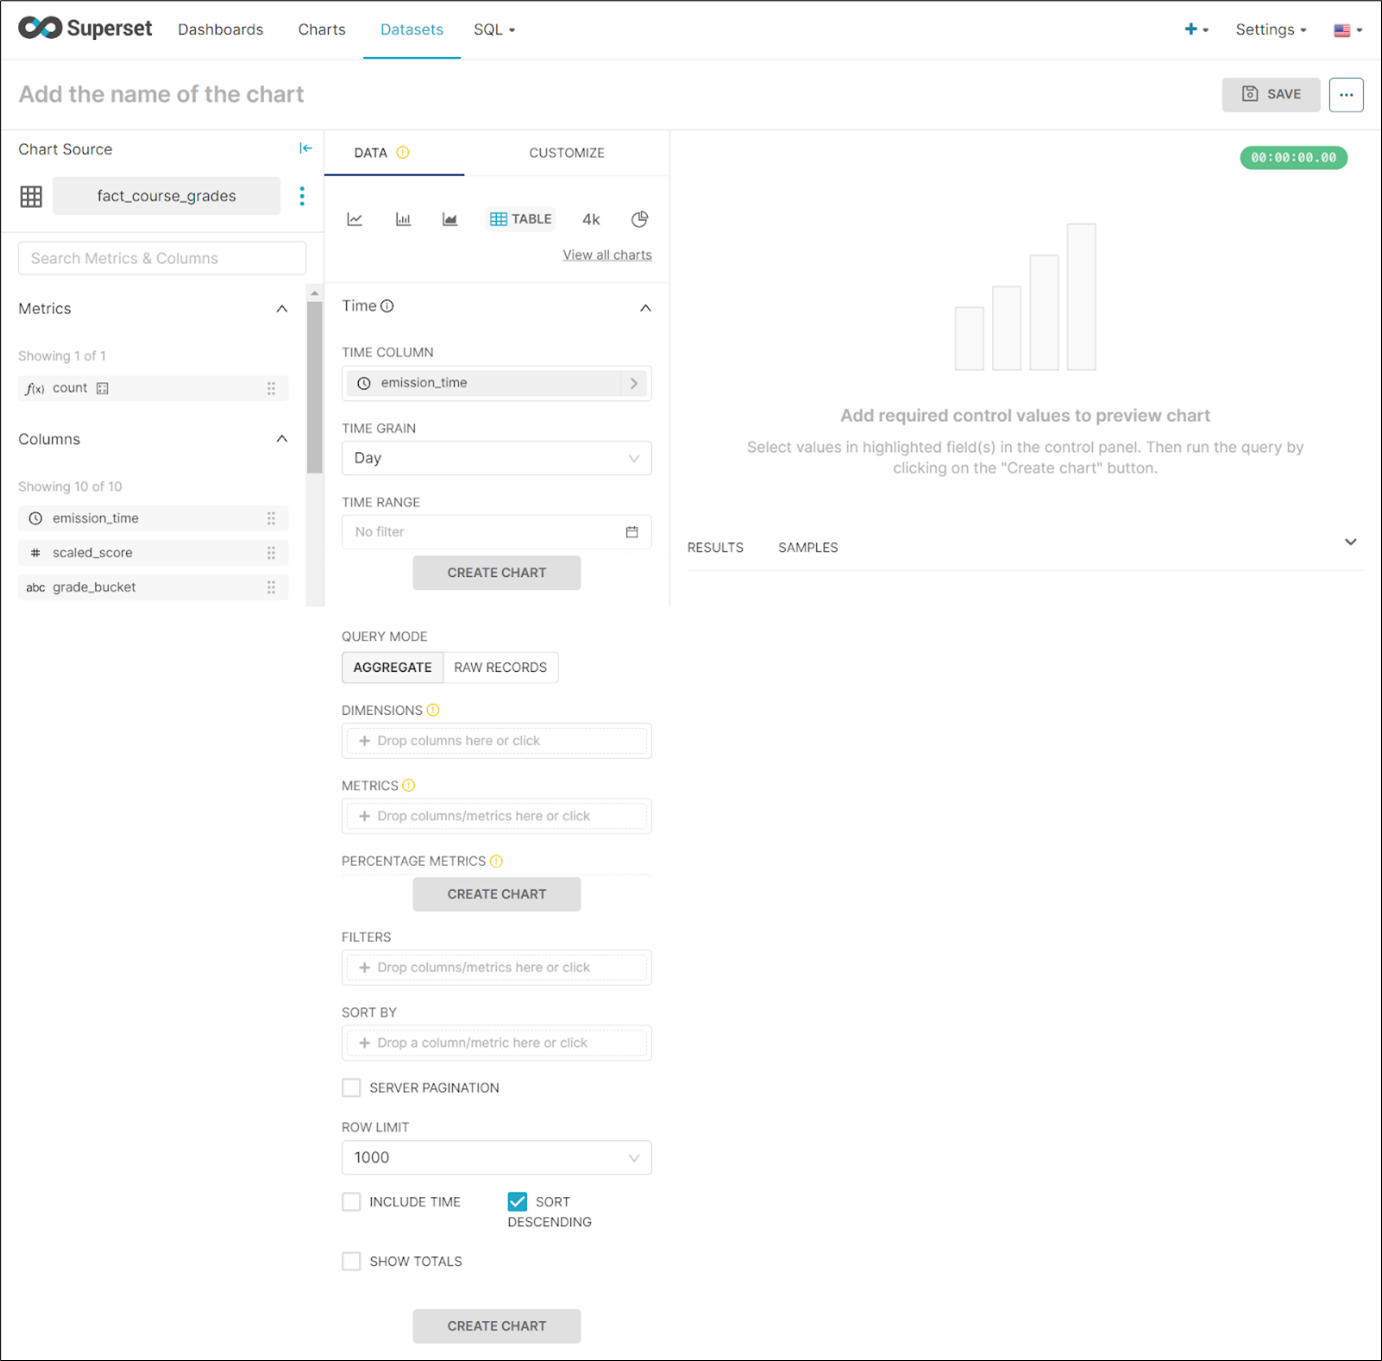
2.4.1.6. Managing Datasets#
As a data analyst, you can view and interact with the datasets directly by going to the Datasets tab.
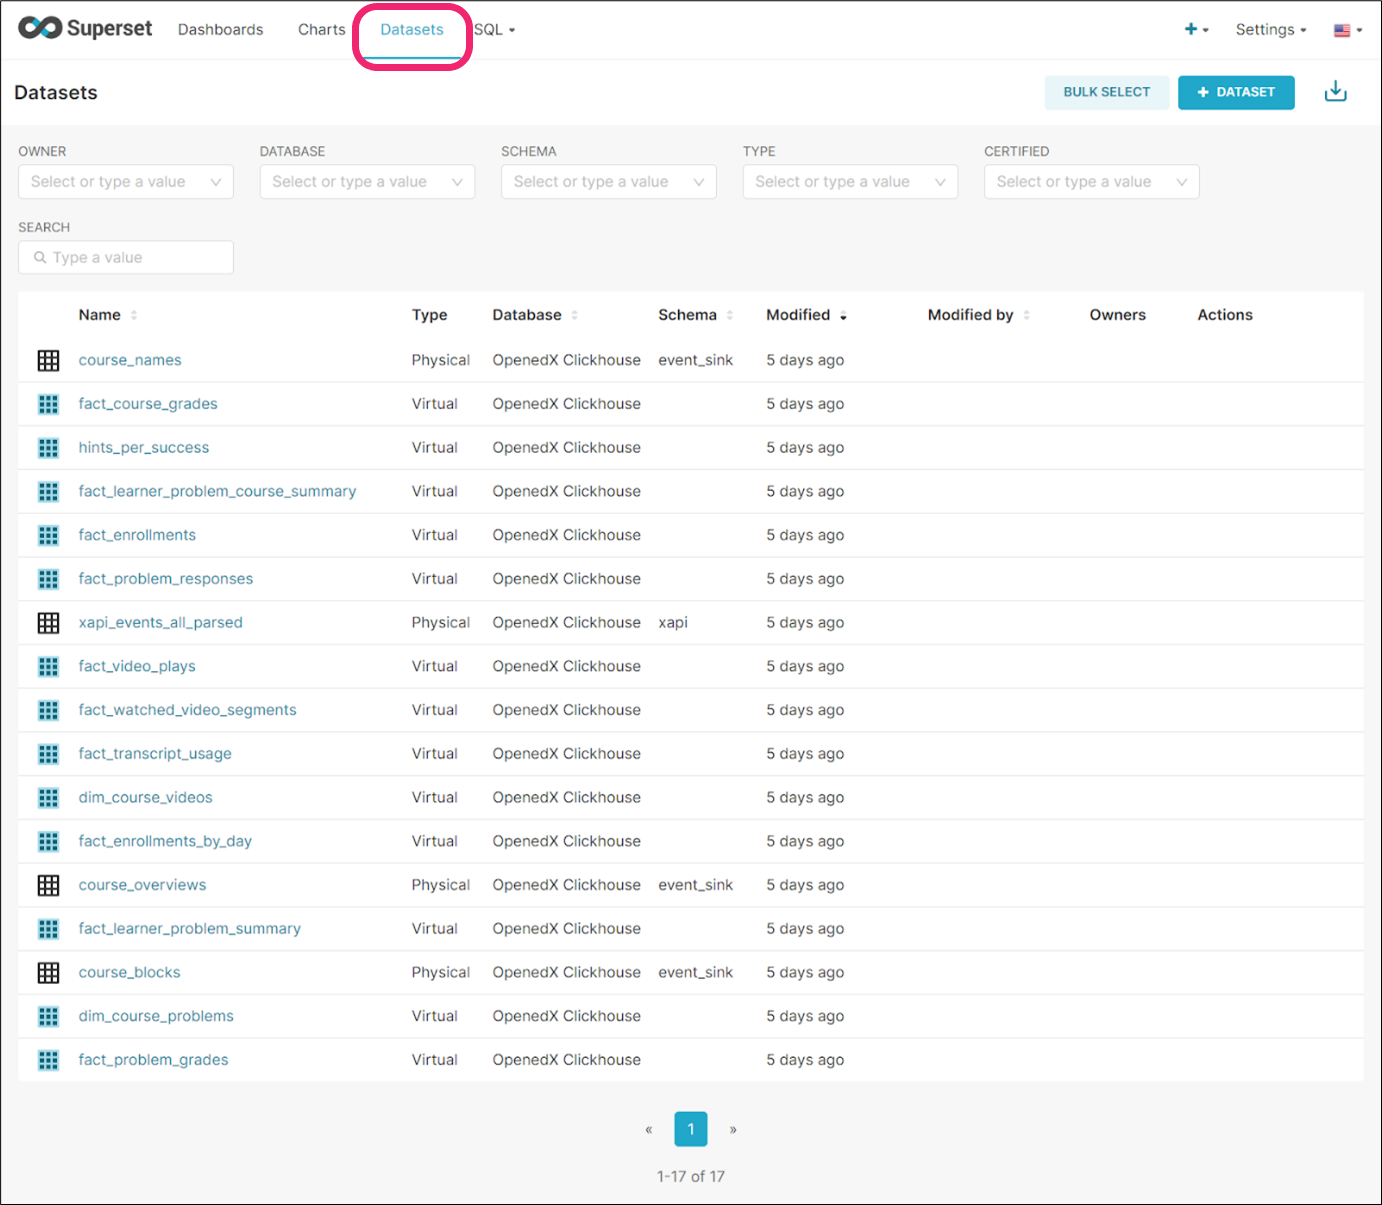
Here is an example of the interactions that can be done with a particular dataset.
2.4.1.7. Interacting with Data Through the SQL Interface#
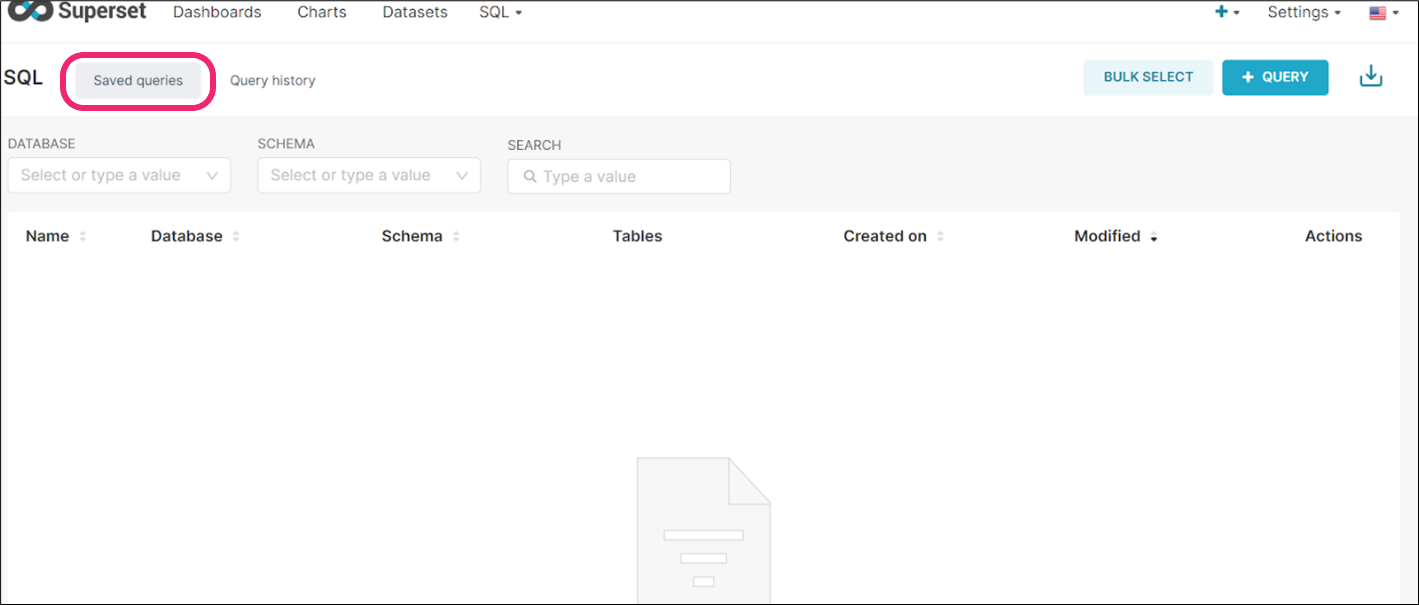
As a data analyst, you have many options available to explore the datasets using SQL directly. To do it, visit the SQL tab to access this option. Then, write and execute your SQL queries.
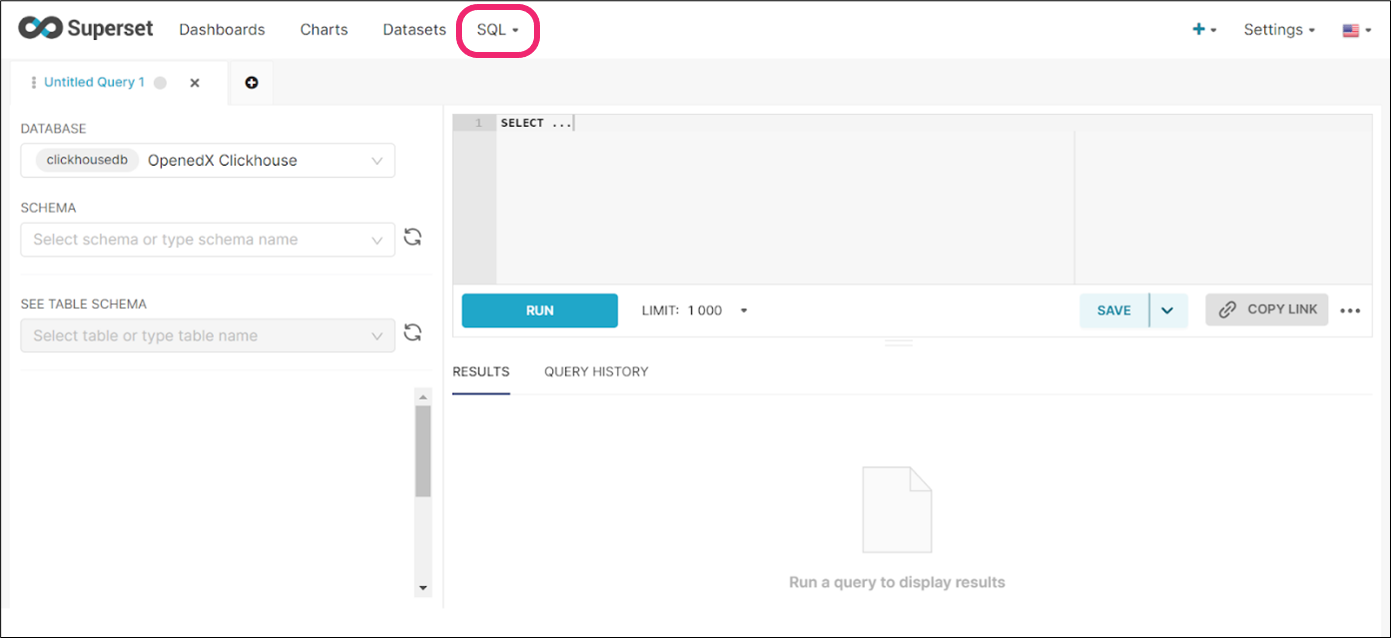
You can Save the most relevant queries to use later.
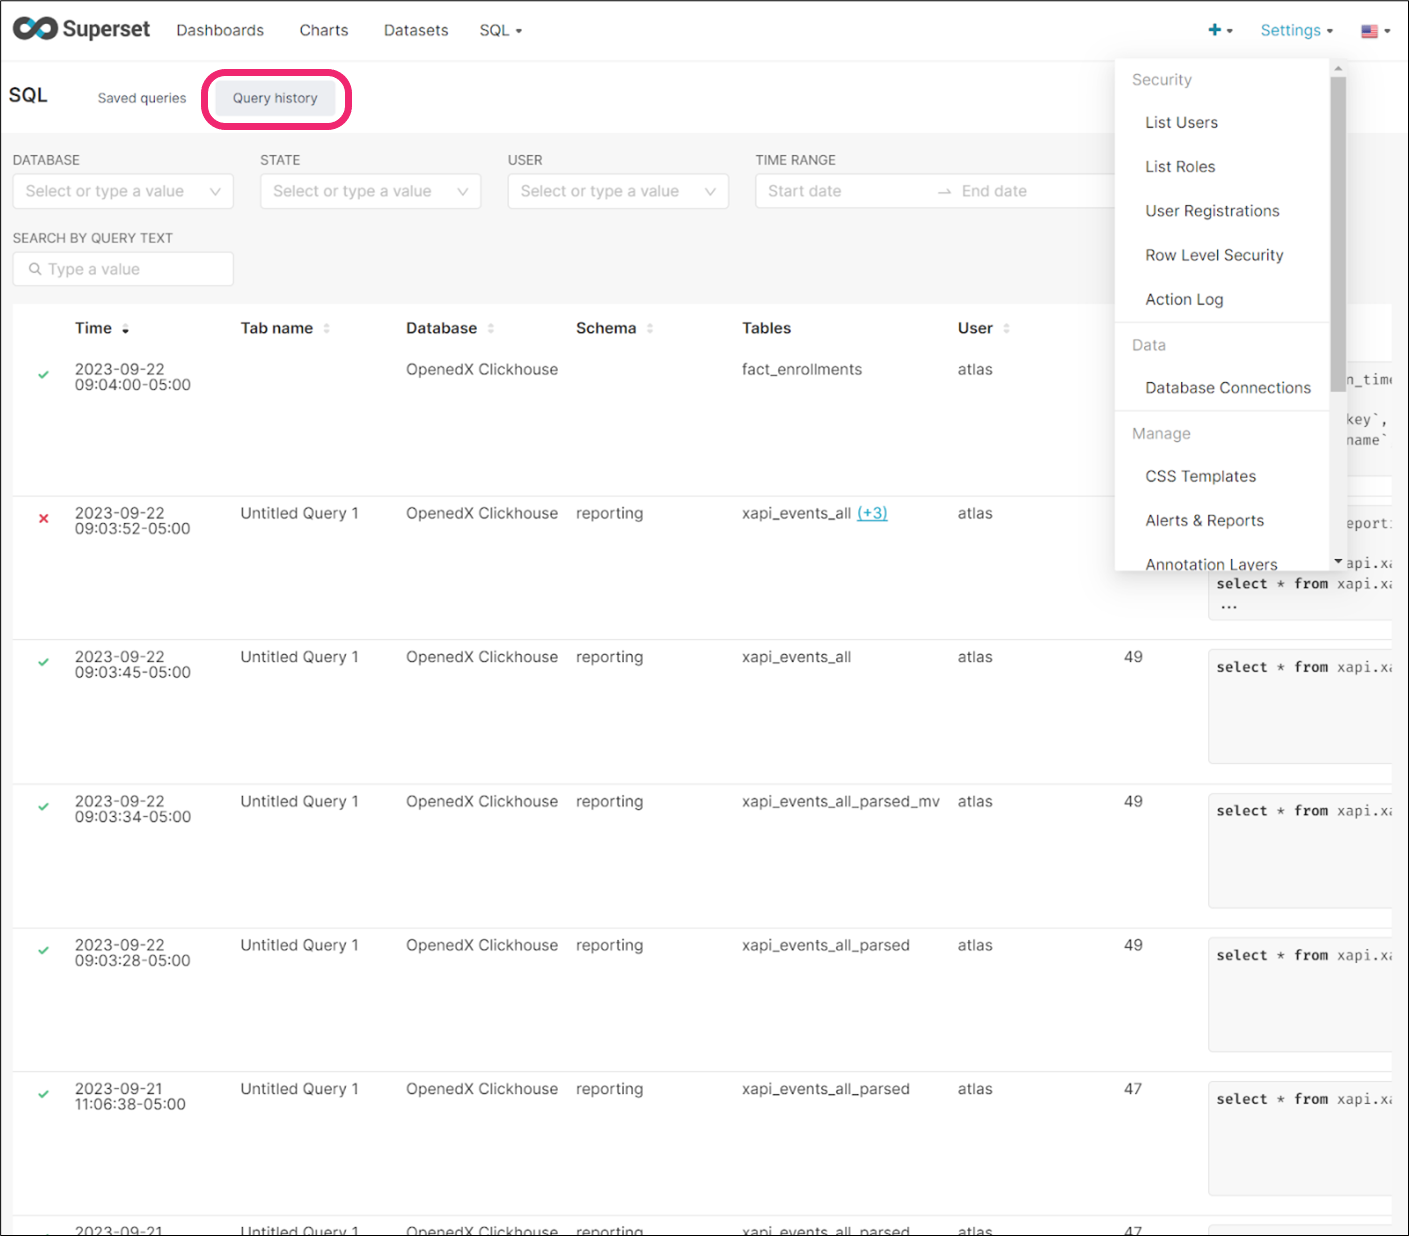
You can also view the history of query execution and their results.
The administration roles for the GTC platform will be distributed across the different technological components that are part of the solution.
This chapter will explore each platform and component, describing the different functionalities and configuration options available for administrators. We recommend that administrators read this entire documentation set to become aware of the various functionalities of the different components and to properly support other users on the platform when required.